Have you ever started your morning with an angry email from a user complaining that a key page on your app is throwing an error? (That is obvisously if you don’t have a fully fledged monitoring and observability system)
You scramble to open your log aggregator, filter by timestamp, extract the stack trace, search the codebase for the file and line number, realize a null reference exception slipped through, fix it, and push to production.
It’s a repetitive, stressful dance. But what if we could automate the diagnostic part using agents?
What if, the moment an unhandled exception occurs, an automated agentic sentinel could fetch the traceback, locate the faulty code in the repository, and draft a detailed GitHub issue with the exact context and a proposed fix?
In this post, we’re going to look at how to build an automated Log Sentinel & Issue Draft Assistant using Antigravity. Along the way, we’ll demystify how Antigravity brings together agents, skills, tools, and loops to automate developer workflows without requiring risky access to production databases.
Visualizing agents through a Kitchen analogy
If you’ve been reading about AI lately, you’ve probably run into terms like “agentic loops,” “retrieval-augmented generation,” or “MCP servers.” It can sound like a lot of magic, but underneath, Antigravity (like many harnesses) structures autonomous AI development around four very simple, grounded concepts.
To make this crystal clear, let’s imagine a restaurant kitchen:
- Agents (The Chefs): An agent is a specialized LLM context configured with a specific role. Just like you have a pastry chef and a sous chef, you can have a code auditor agent, a debugger agent, or an API tester agent.
- Skills (The Recipes): A skill is a structured directory (centered around a
SKILL.mdfile) containing instructions, guidelines, and reference templates. It teaches an agent how to perform a job (e.g., how to analyze a Python traceback or check for code smells). - Tools (The Utensils): Tools are the hands of the agent. They are executable functions—like running a shell command, reading a file, or hitting an external API—that allow the chef to interact with the real world.
- Loops (The Kitchen Timers): Loops handle orchestration and scheduling. They dictate when things run, setting up recurring schedules (like checking the oven every 10 minutes) or waiting for specific triggers.
By combining these four concepts, we can build robust, self-managing workflows that handle production monitoring and triage for us.
While we are using Antigravity for our code examples today, the exact same architectural principles apply to other agentic harnesses like Claude or GitHub Copilot .The syntax might differ slightly, but you’ll always be mapping a brain (Agent) to custom guidelines (Skills), capabilities (Tools), and execution schedules (Loops). Let’s see how our setup works in practice!
Our Setup: The Log Sentinel & Issue Assistant
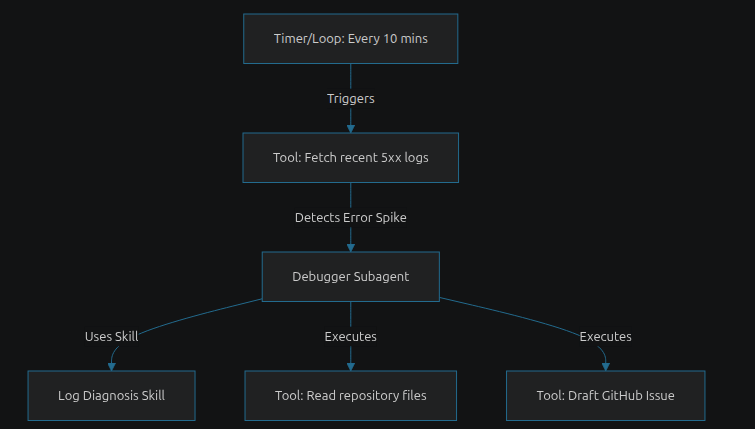
Our goal today is to build a system that polls our application logs for unhandled exceptions. When it finds a new error spike, it hands it off to an agent that specializes in log diagnosis. The agent analyzes the traceback, checks the local repository code, and opens a GitHub issue detailing the bug and proposing a fix.
Here is the basic architecture of what we’re building:
The General Setup: Antigravity Config
To run this entirely without any external orchestration code, we’ll use Antigravity’s declarative configuration format. Because some tools (like GitHub) are universal and others (like our log checker) are project-specific, we will split our setup into a Global configuration and a Local project configuration.
Here is the dual directory structure we will be building:
Global Config (Universal Tools):
~/.gemini/config/
├── mcp_config.json
└── .env

Local Project Workspace (Specific Agents & Tools):
agentic-logs/
├── src/
│   ├── main.py
│   ├── app.log
│   └── fetch_recent_errors.sh
└── .agents/
    ├── tools.json
    ├── agents/
    │   └── oncall_debugger/
    │       └── AGENT.md
    └── skills/
        └── log_diagnosis/
By placing markdown files in these specific folders, Antigravity automatically registers them. No orchestration code required!
How does this map to Claude? If you are building this in Claude Desktop, the setup is fundamentally the same. Your MCP tools configuration lives in a file called
claude_desktop_config.json(rather thanmcp_config.json) and uses the exact same JSON schema. While Claude manages “Agents” and “Skills” via Custom Projects and Artifacts rather than a directory structure, the underlying logic—mapping system prompts to specific MCP tools—remains identical!
Step 1: The Buggy Application (The Raw Ingredients)
Before our Sentinel can monitor anything, we need an application that actually breaks. Let’s create a minimal FastAPI application that writes to a local app.log file and has a single endpoint designed to fail randomly.
Create a main.py file:
import logging
import random
from fastapi import FastAPI

# Configure logging to write to app.log
logging.basicConfig(filename='app.log', level=logging.INFO,
                    format='%(asctime)s - %(levelname)s - %(message)s')

app = FastAPI()

@app.get("/api/data")
def get_data():
    logging.info("Data endpoint hit.")
    # Randomly fail 20% of the time with a divide-by-zero error
    if random.random() < 0.2:
        return 1 / 0
    return {"status": "success", "data": [1, 2, 3]}
You can start this application locally using:
fastapi dev main.py
(Or uvicorn main:app --reload if you are using an older version of FastAPI).
Step 2: Setting up the Tools (The Utensils)
Our debugger agent needs a way to fetch the FastAPI logs and a way to write to GitHub.
First, let’s write a simple shell script (fetch_recent_errors.sh) that reads our app.log file and grabs the recent traceback snippets generated by our faulty endpoint:
#!/bin/bash
# fetch_recent_errors.sh
# Grabs the last 50 lines of logs containing "ERROR" or "Traceback" along with context
grep -A 15 -i "ERROR\|Traceback" app.log | tail -n 50
Next, we expose these capabilities to Antigravity. Because our log script is specific to this project, we define it as a local tool inside our workspace at .agents/tools.json:
{
  "tools": [
    {
      "name": "fetch_recent_logs",
      "description": "Reads recent unhandled exceptions and error tracebacks from the application log.",
      "command": "./fetch_recent_errors.sh"
    }
  ]
}
But what about GitHub?
Instead of writing a custom API wrapper, we can use the Model Context Protocol (MCP). Think of MCP as a universal “USB plug” for AI agents—it’s an open standard that lets you seamlessly attach data sources and tools (like Slack, Google Drive, or GitHub) to your agent without writing custom integration code.
Because GitHub is a universal tool you’ll want across all projects, we add the official GitHub MCP server to our global ~/.gemini/config/mcp_config.json file. This automatically exposes a suite of GitHub tools to our agent—including github_create_issue.
Here is our global MCP configuration:
{
  "mcpServers": {
    "github": {
      "command": "npx",
      "args": [
        "-y",
        "dotenv-cli",
        "--",
        "npx",
        "-y",
        "@modelcontextprotocol/server-github"
      ]
    }
  }
}
TIP: Keep your secrets safe! Notice how we use
dotenv-cliin the command arguments instead of hardcoding our GitHub token in anenvblock. This is the preferred way to handle secrets, as it automatically loads yourGITHUB_PERSONAL_ACCESS_TOKENfrom a.envfile (which you should place globally at~/.gemini/config/.env, right next to your global config file). This ensures you never accidentally check your token into source control!Need
dotenv-cli? If you are on Ubuntu, you can install it globally with:sudo apt install npm && sudo npm install -g dotenv-cliNeed a token? Head to GitHub Settings > Developer Settings > Personal access tokens > Fine-grained tokens, and generate a new token. For maximum security, restrict the token access to only your specific target repository and grant it only “Issues: Read & Write” permissions.
Once you save this configuration, Antigravity will automatically launch the MCP server in the background. You can verify it’s running correctly by simply asking the agent in your chat interface: “What tools do you have available?” You should see both github_create_issue and your custom fetch_recent_logs tool listed in its response! If the GitHub tool isn’t there, double-check your .env file and token permissions.
Now, instead of manually scouring logs, our agent has read-only access to errors and write access to our issue tracker.
Step 3: Teaching the Agent a Skill (The Recipe Book)
Just having tools isn’t enough; the agent needs to know what to look for in a traceback. That’s where skills come in. In Antigravity, a skill is housed in a directory containing a SKILL.md file.
Let’s create a skill file inside our project at .agents/skills/log_diagnosis/SKILL.md and write our instructions:
---
name: log-diagnosis
description: Exception log diagnosis skill for analyzing traceback logs and mapping them to source code errors.
---

# Skill: Exception Log Diagnosis

This skill provides instructions for analyzing traceback logs and mapping them to source code errors.

## Diagnostic Steps
1. **Parse the Traceback:** Find the top-most line of the traceback that belongs to our application codebase (ignore external framework lines like Django or Express internals).
2. **Identify File and Line:** Extract the filename and line number (e.g., `controllers/user.py:127`).
3. **Inspect the Code:** Use codebase reading tools to inspect the lines surrounding the error.
4. **Locate the Bug:** Identify common root causes:
   - Null pointer references / undefined values.
   - Database connection timeouts.
   - Unhandled edge cases in JSON parsing.

## Issue Formatting Guidelines
*   Start with a clear, concise title indicating the exception type and file.
*   Include the raw traceback in a code block.
*   Provide a plain-English explanation of *why* the bug occurred based on the codebase inspection.
*   Suggest a concrete code fix (with a code snippet).
By putting these rules in a structured SKILL.md, we ensure that the agent follows our exact troubleshooting workflow every time it runs.
Step 4: Defining the Agent (The Chef)
Now we need our specialist agent. Instead of writing orchestration code, we define a specialized subagent type declaratively by creating an AGENT.md file.
We place this file at .agents/agents/oncall_debugger/AGENT.md:
---
name: oncall_debugger
displayName: oncall_debugger
description: A specialist debugger agent that diagnoses log errors and files issues.
tools:
  - view_file
  - list_dir
  - call_mcp_tool
---

# Agent System Instructions
You are an on-call debugging assistant. Your job is to analyze log files, diagnose the root cause of errors by inspecting the codebase, and write detailed bug reports.

**Important:** File all bug reports in the `https://github.com/CarlosRodrigues/AgenticMonitoringWorkflow` GitHub repository.

Use the `create_issue` tool from the `github` MCP server to create an issue directly on GitHub. Do not write a local draft markdown file.

use the `log_diagnosis` skill.
Why do we define a separate subagent instead of using a single general-purpose agent? By spinning up specialized subagents, we keep our primary agent’s context clean and focused. The incident debugger doesn’t need to know how to optimize build pipelines or parse database statistics—it only needs to know how to trace logs to source code.
Step 5: Putting it in a Loop (The Timer)
We have the tools, the skill, and the agent. Now we need the heartbeat—the loop that runs periodically and orchestrates the workflow.
Because we are doing this entirely without code, we can schedule a recurring task directly from the Antigravity chat interface using a slash command!
Just type the following into your Antigravity chat:
/schedule "*/10 * * * *"
1. Run the `fetch_recent_logs` tool to check for recent unhandled exceptions.
2. If a traceback is found:
   - Spawn an `oncall_debugger` subagent.
   - Pass the log traceback to the subagent.
   - Instruct the subagent to inspect the codebase and create a GitHub issue.
3. If no errors are found, exit quietly.
Once this loop is scheduled, Antigravity takes care of the rest. Every ten minutes, it wakes up in the background, runs the check tool, and orchestrates the subagent if errors are detected.
And indeed, after requesting a few permissions the issue was created: https://github.com/CarlosRodrigues/AgenticMonitoringWorkflow/issues/1
By the way, this is the companion repository if you want to grab the sample: https://github.com/CarlosRodrigues/AgenticMonitoringWorkflow/
This Pattern is Safe
One of the biggest hurdles when adopting AI in engineering teams is security. Letting an AI agent run code or write to database tables in production is a massive risk.
What makes this Log Sentinel pattern so appealing is its security posture:
- Read-Only System Impact: The agent has zero write permissions on primary databases, cache layers, or server infrastructure. It only reads application logs. Even the code is not modified automatically in this example.
- Isolated Action Boundary: The only write permission the agent possesses is the ability to create issues. Even if the LLM hallucinated, the worst-case scenario is a cluttered issue tracker—not a corrupted production database.
- Human-in-the-Loop Safeguard: Because the output is a draft GitHub issue, human developers remain the gatekeepers. A developer reviews the issue, approves the fix, and merges the code manually.
This makes it the perfect gateway project for teams looking to introduce agentic workflows into their developer operations safely.
A Quick Reality Check: APM Tools vs. Educational Exercises
Let’s address a very valid point if you are running a serious production application, you should probably be using specialized application performance monitoring (APM) and error-tracking platforms like Opentelemetry, Grafana, Sentry, Datadog, etc.
They are highly optimized, operate with near-zero latency, and are built specifically for reliable incident detection and alerting at scale.
Our Log Sentinel here is primarily an educational exercise. It’s a grounded way to show how agentic loops, skills, and tools fit together using a scenario every backend engineer is familiar with. While you could run a simple custom log-grep loop for a small pet project, in a real production stack, we’d recommend hooking Antigravity up as a subscriber to your APM’s webhooks or alert APIs, rather than parsing raw server logs on a timer.
Closing remarks
Building automated workflows with AI doesn’t have to be too complex. By breaking down our operations into agents (who does it), skills (how to do it), tools (what they use to do it), and loops (when they do it), we can construct secure, low-risk sentinel systems that save hours of manual debugging.
Our Log Sentinel is just one example. You can use this same exact pattern to build automated dependency scanners, dead-link checkers, or documentation updates.
I hope this has been useful for demystifying how to build safe, production-ready developer loops. Are you building automated assistant loops in your codebase? What safety boundaries have you set up? Let me know in the comments!
Carlos
Cheers,
Be First to Comment